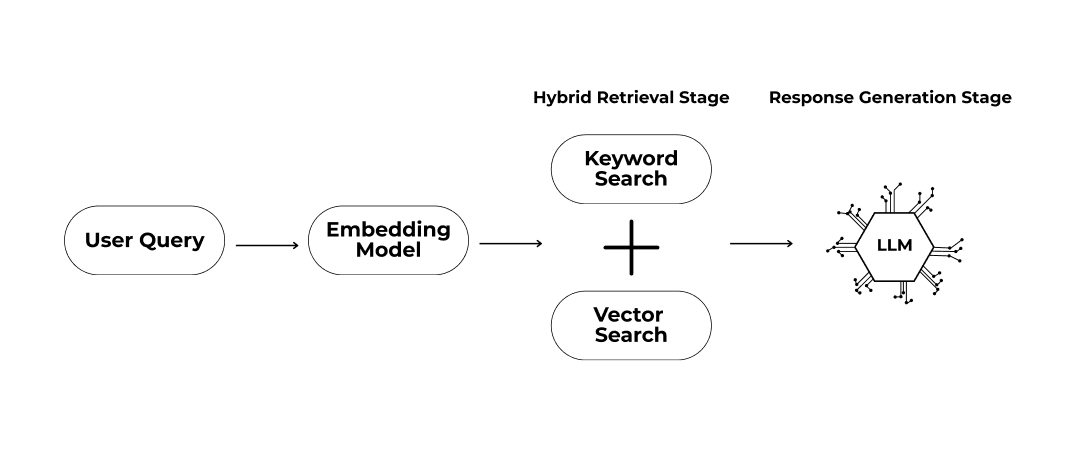
Testing Dataset
16. To ensure comprehensive testing, SIA and Resaro collaborated to create a diverse dataset that included both real-world examples and carefully generated synthetic data, providing a broad range of scenarios for thorough evaluation. To start with, SIA provided access to the questions used in its internal testing, as well as ground-truth retrieved documents and answers for these. Resaro expanded this dataset in two ways:
- Synthetic Data Generation: Resaro used its internal LLM-based synthetic data pipeline to generate additional synthetic questions and answers. This expanded the breadth of the dataset and allowed for additional testing across a wider range of potential scenarios.
- Data Perturbation: Resaro perturbed the questions to test the application’s robustness. These perturbations, such as synonyms and misspellings, were designed to mirror real-world usage scenarios rather than adversarial cases, which were already mitigated by the application’s guardrails.
17. The final dataset comprised 2,800 questions, offering a comprehensive mix of real-world and synthetic data. Approximately two-thirds of the dataset was fully synthetic, while the remaining one-third was partially synthetic, based on perturbations of SIA’s internal testing dataset.
Testing Methodology
18. Application testing comprised two stages, which were carried out in relation to both the non-perturbed (to identify baseline performance) and the perturbed questions (to assess robustness):
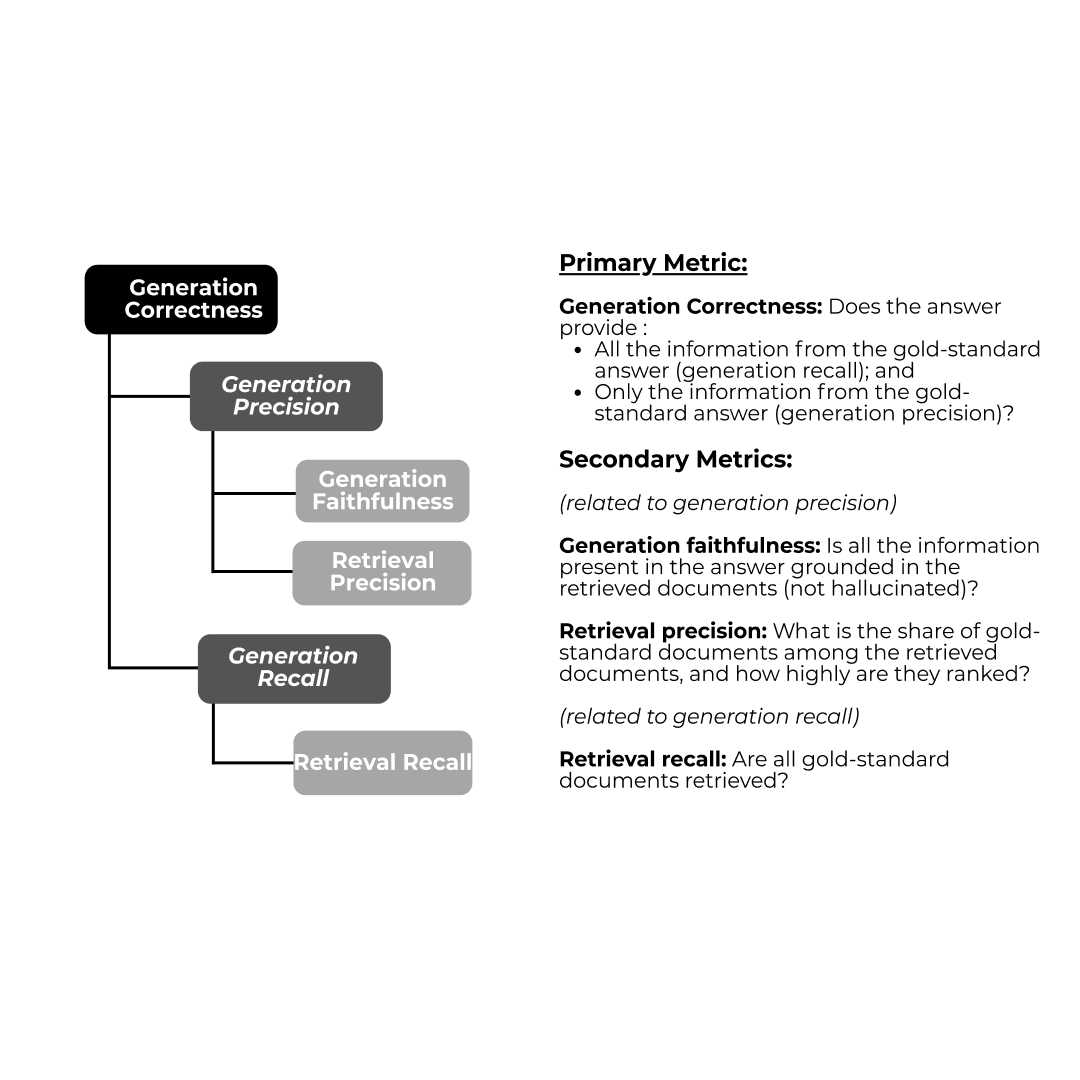
- Correctness of the Final Output: Resaro first measured generation correctness, assessing whether the final output contained all the information from the ground-truth answer, and only the information from the ground-truth answer.
- Testing of Individual Components: Resaro then used other metrics to diagnose specific issues in the retrieval or synthesis stages that contributed to the application’s performance in generating the final output.
First Stage: Baseline Performance – Testing of the Final Output
19. The first stage focused on measuring the correctness of the application’s final output , providing insights into its alignment with ground-truth data. This stage comprised of the following four steps:
- Decomposition of Responses and Ground-Truth Answers: Both the generated responses and ground-truth answers were broken down into distinct claims4 using an LLM.
- Precision5 Assessment: Each generated claim was checked by a judge LLM to ensure it was supported by a ground-truth claim, ensuring no extraneous or fabricated information was included.
- Recall6 Assessment: Each ground-truth claim was checked by a judge LLM to verify its presence in the generated response, ensuring completeness.
- F1 Score7 Calculation: Precision and recall scores were combined into an F1 score. This provided a single measure of the balance between the completeness (recall) and accuracy (precision) of the generated response.
Second Stage: Deep Dive into Baseline Performance – Testing of Individual Components
20. The F1 score from the first stage provided a high-level measure of the application’s performance but lacked the granularity needed to provide actionable insights into specific components within the application pipeline. For example, precision challenges, such as the inclusion of incorrect or extraneous information in the output, could stem from issues like hallucination (i.e., content not grounded in retrieved documents) or retrieval of irrelevant documents. However, the F1 score alone would not shed light on this, highlighting the need for other metrics.
21. The second stage of testing therefore aimed to test the individual components of the application using three additional metrics:
- Generation Faithfulness: Assessed whether the claims in the final response were grounded in the retrieved documents, helping to identify instances of unsupported or fabricated information.
- Retrieval Precision: Assessed whether irrelevant or unrelated documents are being retrieved during the information retrieval stage.
- Retrieval Recall: Measured the extent to which all necessary documents were retrieved, identifying omissions that could lead to incomplete responses.
First and Second Stages: Robustness Testing – Perturbed Questions
22. This portion of the testing process examined the application’s ability to handle perturbed questions that reflect real-world variations in user input, such as misspellings and the use of synonyms. Robustness testing offered a valuable perspective on the application’s capacity to manage such diverse inputs, effectively complementing the baseline performance test.
Applying the Testing Results and Continual Testing & Monitoring
23. These metrics from testing are useful in providing actionable insights:
- The end-to-end test of final output highlighted the performance of the application in a human-interpretable manner e.g. a generation recall score of 0.95 shows that 95% of claims in the ground-truth answers were found in the generated answers.
- The detailed test of individual components could show which part of the application to focus on for further development e.g. if the retrieval pipeline performs poorly in robustness tests, it suggests it needs to be enhanced to deal with diversity in user queries e.g. by finetuning the re-ranking model.
24. To move from metrics to a go/no-go decision on deployments requires thresholds. These need to be determined by the organisation based on the nature of the application and the tolerance for error. In making a deployment decision, organisations may consider:
- Conducting a systematic analysis of error patterns to identify potential failure modes, assessing how these could affect end users and determining whether the impact is acceptable. In the context of generation correctness, error patterns include omissions (i.e. not including relevant details in the output) and ungrounded responses (i.e. output is not based on the retrieved data).
- Assessing whether the metrics used accurately reflect their real-world requirements and adjusting their interpretation accordingly. For example, a low F1 score driven by poor recall performance may be acceptable in applications where precision is the priority.8
- Benchmarking results against industry standards, prior versions of applications or alternative solutions to contextualize performance.
25. While pre-deployment testing helps to validate that the application meets the organisation’s own internal safety standards, continuous testing of the application’s output and behavior post-deployment is equally important as it can help detect emerging issues in real time, enabling timely intervention. One should run these tests when there are material changes made to the application, to check if the changes have impacted safety and performance. However, even if no changes are made, such testing is still important. For example, it allows for the detection of data drift, where the real-world data that the application encounters during deployment differs from the training data it was built on. Such testing for data drift can be performed by capturing a share of the production data that is as different as possible from the pre-deployment data and drafting ground-truth responses to test against the actual responses of the application.
Future Areas of Work
26. The current testing methodology provided a structured framework for testing the output correctness of a RAG-based website search application. By combining various metrics such as precision, recall and generation faithfulness, the approach offered valuable insights into the application’s ability to provide accurate and complete responses, at both the output and component levels.
27. The test design laid a foundation for future iterations that could: (a) account for other factors in user satisfaction, such as clarity, relevance, and fluency; (b) take into account the relative importance of the claims in the ground-truth data; and (c) account for LLMs’ tendency to generate varying outputs for the same query. These aspects, elaborated upon below, represent opportunities for a more comprehensive evaluation of the application’s performance.
28. Capturing linguistic quality and user experience: Responses that are correct but poorly structured or difficult to understand can undermine an application’s utility. Additional metrics such as linguistic quality, relevance or user experience are thus vital to obtaining a more comprehensive understanding of the application’s overall performance. That said, there will still be a need for ground truth-based metrics. User feedback is useful to understand user experience but given that users are unlikely to have ground-truth information, it is unlikely to accurately capture the correctness of a response.
29. Prioritising claims: Incorporating a measure of relative importance between claims would facilitate a prioritisation of the most critical claims, allowing the testing process to better align with human judgment and provide more meaningful insights into the application’s performance.
30. Executing multiple runs: Since LLMs are probabilistic and can generate varying outputs for the same query, conducting multiple runs per input can help improve the statistical robustness of the testing process. Averaging performance across multiple runs would provide a more reliable measure of the application’s output correctness, reducing the impact of response variability. Additionally, multiple runs allow for the identification of inputs that the application consistently struggles to get right, highlighting particularly problematic queries that may warrant greater focus.
Conclusion
31. This exercise demonstrated that LLM application testing, complemented with 3P testing, is an important step in ensuring overall AI safety and reliability. The structured approach shared serves as a reference point for future testers and contributes to global efforts to standardise LLM application testing. Nonetheless, opportunities for methodological improvement remain, given that the science of AI testing is nascent and evolving quickly. Also, testing should also not be a one-time exercise; it must be conducted periodically and complemented by continuous monitoring to address evolving challenges and maintain application safety and reliability over time.
1 Bengio, Y., Mindermann, S., Privitera, D., Besiroglu, T., Bommasani, R., Casper, S., Choi, Y., Fox, P., Garfinkel, B., Goldfarb, D., Heidari, H., Ho, A., Kapoor, S., Khalatbari, L., Longpre, S., Manning, S., Mavroudis, V., Mazeika, M., Michael, J., … Zeng, Y. (2025). International AI Safety Report. arXiv. https://doi.org/10.48550/arXiv.2501.17805
2 As set out in Bengio et al. (2025), risk identification and assessment form the initial stages of AI risk management practices. Bengio, Y., Mindermann, S., Privitera, D., Besiroglu, T., Bommasani, R., Casper, S., Choi, Y., Fox, P., Garfinkel, B., Goldfarb, D., Heidari, H., Ho, A., Kapoor, S., Khalatbari, L., Longpre, S., Manning, S., Mavroudis, V., Mazeika, M., Michael, J., … Zeng, Y. (2025). International AI Safety Report. arXiv. https://doi.org/10.48550/arXiv.2501.17805
3 We referred to the risk taxonomy in Slattery et al. (2025). Slattery, P., Saeri, A. K., Grundy, E. A. C., Graham, J., Noetel, M., Uuk, R., Dao, J., Pour, S., Casper, S., & Thompson, N. (2024). The AI risk repository: A comprehensive meta-review, database, and taxonomy of risks from artificial intelligence. arXiv. https://doi.org/10.48550/arXiv.2408.12622
4 Claims are distinct pieces of information or factual statements. For example, a generated response from the application might be “Travellers require a visa for entry and their passport must be valid for at least six months”. This response might be broken down into two claims: (1) A visa is required for entry and (2) The passport must be valid for at least six months.
5 Precision measures the accuracy of a system’s outputs by assessing how many of its results are correct. Imagine searching for “red shoes” online. High precision means that most of the results are actually red shoes, not sandals.
6 Recall measures the completeness of a system’s outputs by assessing how many of the total possible correct results it successfully identifies. Using the same example, high recall means the search engine found most of the red shoes available online, even if it also showed other red items.
7 The F1 score combines precision and recall into a single score. It measures the overall accuracy of a system, balancing showing only relevant results (i.e, precision) with finding all the relevant results (i.e. recall). A high F1 score for red shoes would mean that most of the results are red shoes and not too many other things.
8 For example, in email spam filters, while high recall (i.e. catching all spam emails) is beneficial, it is generally less harmful to let some spam emails through than to misclassify critical messages as spam and risk them being overlooked.